CARY D. PALMER
Crop and Livestock Reporting Service
Austin, Texas
EIGHT YEARS AGO, I came to Texas and was placed in charge of the Crop and Livestock Reporting Service . . . and just 8 years ago I received a warm welcome from this Association. Through the years, the Texas Pecan Growers Association has supported the Crop Reporting Service under conditions when estimates were not just what they would like to have had in terms of accuracy, and I do appreciate this cooperation.
Now, in terms of years . . . a long time ago. . . . in fact, 100 years ago the Crop Reporting Service was born On July 11, in conjunction with the issuance of the monthly crop report, the Statistical Reporting Service began the hundredth “birthday” celebration of crop and livestock reporting in USDA. How did it happen? Back on the East Coast in Maryland, wheat producers were concerned that they were not getting a fair price for their crop and the buyers had better information than the farmers did. The farmers knew about the crop on their own farms and in their own neighborhood, but in the neighboring States of Pennsylvania, Virginia and Deleware, they were dependent on what the buyers told them.
First, these Maryland wheat farmers organized their own crop reporting service, but soon found that it did not operate as they thought it should, and they thought this was a service that their government should perform for them. So they petitioned the government for help, and the first appropriation for agricultural statistics was for $1,000.
This was the beginning, and down through the year’s new crop items and new livestock items have been added to the crop reporting program, mostly at the request of interested farmers.
Reports are prepared in the State offices (in Texas, it is in the Federal Building in Austin) based on reports from farmers and from field observation.
The reports for Texas and other States are forwarded to Washington, D. C. where they are reviewed, collated and become a part of the U. S. crop report. A tight security is kept so that there can be no speculation on the various crops. The doors are locked and a guard is posted so that no one can enter and no one can leave. All windows and blinds are closed. A 3 o'clock when the report is ready, the Secretary of the Crop Reporting Service comes out with the report and it is given to the news media; thereby, becoming available to the entire nation at the same time.
Now, 50 years ago is how long we have had pecan estimates. I have no record of how they began. In 1956, when questions were raised as to whether we should have the August 1 forecast, the Crop Reporting Service went to the Growers Association and it was at their request that these reports were continued. Again in 1964, the accuracy of the August 1 forecast was questioned, and again the growers were contacted. They requested that the reports be continued even though the shellers preferred to have the reports discontinued. Now let us look at trends in pecan production.
Texas Pecan Production, Figure 1, shows the sharp year to year up and downs of production in all Texas pecans. It shows moderate increases in all named variety pecans. The very wide fluctuations in production indicate the reason for price variations and marketing problems.
Figure 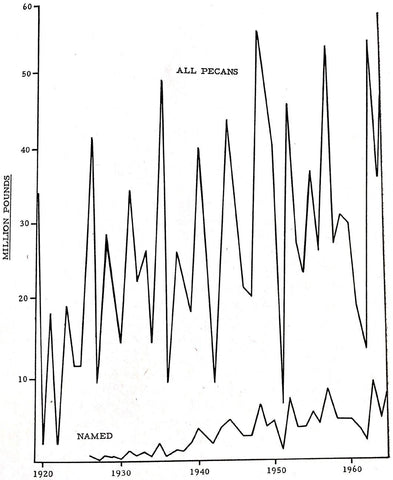 Texas pecan production.">
1. Texas pecan production.
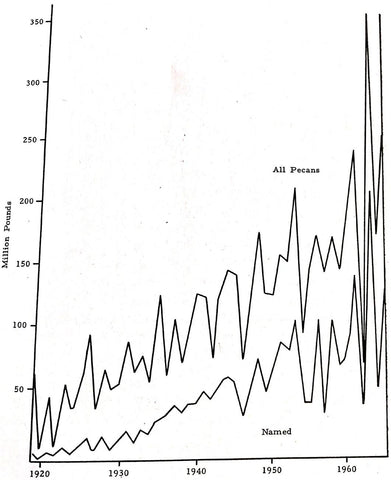
U. S. Pecan Production, Figure 2, reflects not so, great year-to-year variations as Texas, but still from peak to valley from a level of below 50 million pounds annually in the early I920's to up in the 200 million pounds annual level early in the 1960's. Much of the increase in U. S. production reflects the increase in production of named varieties, primarily in the southeastern states. The greater stability in year-to-year production of named varieties means somewhat greater stability in U. S. production of all pecans than for Texas.
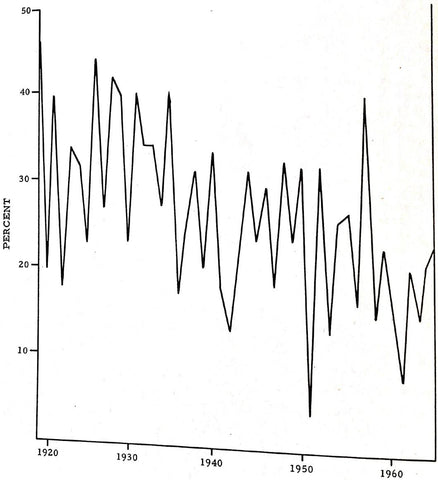
Texas Pecan Production Relative to the. U. S. has decreased over the years from about a third of the U. S. production on the average in 1920’s and 1930’s to less than one-fifth in the I960’s. Production of named varieties in Texas has not kept pace with the increase in most of the other States. Now, we may look at supply and price.
Figure 4 shows the U. S. pecan production with the August 1 forecast on the horizontal scale and the season average price on the vertical scale.
Figure 5 shows the August 1 forecast plus the July 1 carryover for all inshell nuts except walnuts, almonds and filberts, and the. U. Ss. price. Here the relationship is better, indicating the very definite relationship between supply and price and that when the supply of pecans gets up around 250 million pounds the price for the season for all pecans averages about 20 cents or lower. It should be recognized that the carryover figures includes nuts other than pecans and are not the most suitable measure of carryover in relation to the pecan price.
Now we may consider the tools used by the Government's Crop Reporting Service in estimating the pecan crop. Two factors are of prime importance:
1. Most of the information is collected by mail for it is least expensive.
2. The information is collected from those who know most about the crop . . . the growers (in fact, the commercial pecan growers).
When pecan reports were first started by the government nearly half a century ago, the question was asked on a general crop report schedule along with questions on peaches, hay, wheat, cotton, eggs and milk; and naturally, the questionnaire went to the general farmers. The question read, “Pecans: Report for your Locality Condition as Percentage of a Full Crop.” This procedure produced too many reports from farmers who were not fully informed on the pecan crop, and at the suggestion of growers in the early 1950's, a special list of pecan growers was established and they were asked to report as shown below:
REPORT FOR YOUR LOCALITY
1. Condition as percent of full crop . . . . . . . . . . . . . . . . . . . . . . . . . . .---Percent
REPORT FOR FARM YOU OPERATE
1. Total pecans harvested last year . . . . . . . . . . . . . . . . . . . . . . . . . . . ---Pounds
2. Total pecans expected this year. . . . . . . . . . . . . . . . . . . . . . . . . . . . ---Pounds
These reports are received from approximately 200 commercial pecan growers on August 1, September 1, October 1, November 1 and December 1. Growers also are asked to report on February 1 the disposition of the crop; that is, the pounds sold in shell to retailers, wholesalers and pounds sold to shellers.
As a final check as a basis for revisions, schedules are mailed to buyers to obtain the report on pecans sold in shell to wholesalers, retailers and direct to the consumer. The questionnaire also asks for the State in which purchased unshelled pecans were grown. The main check, however, on the pecan crop is reports from all shellers on pecans sold in the shell to wholesalers, retailers, direct to the consumer and the quantity of pecans actually shelled, which, of course, accounts for the disposal of the bulk of the crop. This questionnaire asks of total quantity handled, how many pounds were grown in each State.
So, during the growing season, we get reports from growers on the prospective size of the crop and at the end of the season we get a report from buyers and shellers on the disposal of the crop.
Now let us consider the accuracy of the production forecasts. There has been some improvement since reports from commercial pecan growers became
 Pecan production.">
Figure 2. U. S. Pecan production.
 pecan production, percent of U. S. total. ">
Figure 3. Texas pecan production, percent of U. S. total.
established as a regular part of the reporting procedure. The U. S. production of pecans is forecast August 1, September 1, December 1, and the final is shown on Table 1. The same figures, only in terms of percentage of the preceding of year, are shown in Table 2. Two aspects stand out:
1. The forecasts show the wide swing from large to small and from small to large crops quite well. They indicate relatively the size of the crop and should be of serviceable accuracy for price-making purposes.
2. The August 1 forecast is about as reliable as the September 1 and even the December 1 forecast. Not shown are the figures for October 1 and November 1, but the same conclusion would be warranted.
Fiqure 4. U. S. pecan production, August Figure 5. U. S. pecan production, August
1 forecast (million pounds). 1 forecast + July 1 carryover (excluding walnuts, almonds, filberts) (million pounds).
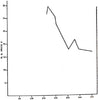
Table 1 U. S. PECAN PRODUCTION
(Million pounds)
| Year | Aug. 1 | Sept. 1 | Dec. 1 | Final |
| 1956 | 170 | 161 | 160 | 174 |
| 1957 | 119 | 122 | 112 | 141 |
| 1958 | 179 | 173 | 162 | 175 |
| 1959 | 138 | 132 | 128 | 144 |
| 1960 | 182 | 185 | 181 | 188 |
| 1961 | 224 | 230 | 222 | 247 |
| 1962 | 91 | 81 | 69 | 71 |
| 1963 | 279 | 294 | 290 | 363 |
| 1964 | 124 | 122 | 137 | 174 |
| 1965 | 250 | 256 | 264 |
Table 2 U. S. PECAN PRODUCTION
Percent of Preceding Year
| Year | Aug. 1 | Sept. 1 | Dec. 1 | Final |
| 1956 | 116 | 110 | 109 | 118 |
| 1957 | 68 | 70 | 64 | 81 |
| 1958 | 127 | 123 | 115 | 124 |
| 1959 | 79 | 75 | 73 | 82 |
| 1960 | 126 | 128 | 126 | 131 |
| 1961 | 119 | 122 | 118 | 131 |
| 1962 | 37 | 33 | 28 | 29 |
| 1963 | 393 | 414 | 408 | 511 |
| 1964 | 34 | 34 | 38 | 48 |
| 1965 | 144 | 147 | 152 |
Now how can the estimates are improved?
If instead of a little under 200 reports each month, reports came from 300 commercial pecan growers, a much better representation would be more available.
Another thing that might improve the estimates of pecans would be more basic information for the location or pecans within the State. The Agricultural Census every 5 years provides some county data, but it is 2 years after the census before it is summarized, and it has never given a real good estimate or the number of pecan trees in the different counties. A survey of pecan trees should be made so that potential for different areas can be established.
The Interim Committee of Agriculture has been holding hearings over the State and there have been presentations be various groups indicating a real need for county figures. If the State Legislature should provide for county data, there will probably be some improvement in the pecan estimates.
Incidentally, Texas is the only major agricultural state in the Nation that does not have a State-Federal Reporting Service. All funds come from the Federal Government and are designed primarily for State estimates . . . not county estimates.
Thank you for the opportunity to present these charts and the pecan estimating procedure used. If there are any questions or any information you would like to have, please let us know and we will be glad to supply it.